
http://www.guardian.co.uk/politics/2013/apr/12/thatcher-britain
James Ball
From the right-to-buy scheme to social attitudes, James Ballexamines how life changed in Britain under Margaret Thatcher
Perhaps the only undisputed facts of Margaret Thatcher's premiership are that she first entered 10 Downing Street as prime minister on 4 May 1979 and departed with a tear in her eye on 28 November 1990.
Everything in between: how she changed Britain, what actually changed, and especially what it means for us today, has been the subject of an intermittent war of words throughout the two decades since her resignation – and it is a war that has intensified in the days since her death.
It's only by trawling through the historical reference – from census data to coal board records, from the World Bank to the Institute for Fiscal Studies, and from more than 30 years of social research – that even the basic facts about the nation reshaped during the Thatcher era take form.
What they show of Britain's new landscape is telling – but, of course, what will always be a matter for argument is how much would have happened with any prime minister, and how much was down to the Lady.
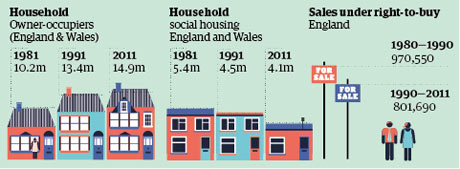
For millions of Britain's better-off working class – the famed C2s targeted by political strategists and tabloid owners alike – the most direct impact of Thatcherism was on levels of home ownership: Thatcher's dream of a nation of owner-occupiers was perhaps one of her most fully realised.
Figures from the 1981 and 1991 UK censuses show the scale of this change. In 1981, two years into Thatcher's premiership, England and Wales had 10.2 million owner-occupiers. A mere decade later, their ranks had swelled to 13.4 million.
 Credit: Guardian graphics
Thatcher certainly didn't invent the ideal of home ownership, but she did an astonishing amount to boost it – and far more than any government since. Twenty years later, the 2011 census, reporting on a Britain with a population six million higher than in Thatcher's time, recorded that the number of owner-occupiers had only ticked up to 14.9m households.
Many of the new Thatcher-era first-time buyers gained their ownership through the right to buy scheme, giving council tenants the right, for the first time, to buy their homes at a hefty discount – about which Thatcher had initial reservations, due to her instinctive thrift.
In England alone, more than 970,000 local authority-owned houses were sold through the scheme during Thatcher's premiership, more than have been sold in the two decades since.
Such changes clearly came with a cost, and one of the most direct costs was the gradual decrease in the amount of social housing – and the resultant long waits on housing lists today – from a country with a growing population and atomising households (the number of people per household in the UK is slowly but steadily falling, as more of us live alone).
In 1981, England and Wales had 5.4m households in social housing. By 1991, this had dropped by 900,000 to 4.5m. In the post-Thatcher years, this gradual drop-off has endured, with 4.1m households living in social housing at the last census.
That was only the most direct effect. In addition, many of the first people to buy their council homes through right to buy almost immediately started to struggle with their mortgages.
As a result of the Thatcher government's decision to target and control inflation – seen by many people then and now as a necessary move – interest rates (and therefore mortgage repayments) never fell below about 7.4% during Thatcher's premiership, and peaked at 17%.
This is a figure unimaginable to many of today's younger adults: interest rates have not been above 6% since the turn of the millennium.
For some families these pressures were very real: James and Maureen Patterson were among the first families to buy their council home, and were visited by Thatcher as they did so. In the following years, their marriage disintegrated, apparently in part due to financial pressure on making the mortgage repayments.
Thatcher's housing policies had one other long-term legacy, hailed by some and cursed by others: house prices rocketed during and after her tenure. According to figures from the Department for Communities and Local Government, the average selling price of a house in 1979 was £19,925. By 1990, this had tripled, to £59,785. Over the next two decades, it multiplied again, reaching £251,634 by 2010.
The economy has been subject to the whims of the housing market ever since Thatcher: the housing crash and negative equity of the early 1990s were hardly unrelated to the accompanying recession, while the consumer boom of the early 2000s was fuelled by housing debt – as was the subsequent, interminable, bust.
In this, the coalition government came in to power tacking, tacitly, away from Thatcher, with a vow to rebalance the economy away from such housing-fuelled booms, of which the housewife-frugality-espousing Thatcher may not have approved but nonetheless helped fuel.
But unlike the Lady, George Osborne proved for turning, and plans to revitalise the economy with his help-to-buy policy. The echoes of Thatcher are surely not accidental.
The argument over the wider impact of Thatcherism on Britain's economy makes disagreements over housing policy look trivial.
Looking only at the core measure of economic performance – GDP growth – Thatcher's performance was slightly better than that of her predecessor, James Callaghan, but slightly worse than under Tony Blair, with average growth over her tenure standing at around 2.3% a year.
This kind of generalisation hides every argument that matters, though. Thatcher made changes to the UK's tax system, some changes to welfare, and many to the nature of British jobs, both through privatisation and economic liberalisation – not least in her battle with the unions.
Perhaps the best look at what Thatcherism meant for British families comes from a series of measures calculated by the Institute for Fiscal Studies, which calculated household incomes after tax (and any income from benefits), and put them into monetary amounts relative to 2010-11 prices, stripping out the effects of inflation.
 Credit: Guardian graphics
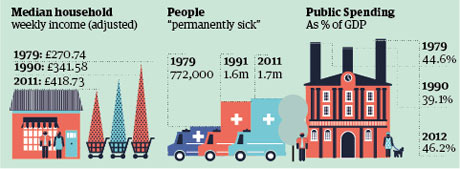
These figures show families got richer. The median household – the household right in the middle, where half are richer, half are poorer – earned the equivalent of £270.74 a week in 1979. By 1990, this had increased by 26% to £341.58.
But, as you would expect, these gains were nowhere near evenly distributed, and the poorest got the least. A family in the bottom 10% had a weekly income of £151.58 as Thatcher came into power. Eleven years later as she left Downing Street, the family had just £158.57 – a mere 4.6% more. Such stagnation for the poorest families was not inevitable: though inequality remained high in the post-Thatcher era, by 2011 that income had risen to £215.86.
The richest families – the top 10% – did far better, with their incomes increasing from the equivalent of £472.98 in 1979 to £694.83 in 1990. The good times for high-rollers continued post-Thatcher, with 2011 incomes of £845.54 a week.
The IFS figures are stark on the dispersion of British society in income terms through the Thatcher era, and this had a knock-on effect onpoverty as it is typically measured.
The common international standard for poverty is a relative one: a family earning less than 60% of the median income, meaning its members are excluded from many aspects of a nation's life. By this measure, though, a family in poverty in 1990 may be richer than one not in poverty in 1979.
It is perhaps illustrative to note that in 1981 3.7m households lacked (or had to share) either an inside toilet or bath. By 1991, only 259,000 did.
Still, the poverty figures don't look good: the number of children in poverty almost doubled under Thatcher, from 1.7 million in 1979 to 3.3 million in 1990. Pensioner poverty in the same period increased too, from 3.1 million to 4.1 million. Those numbers rise still further if housing costs are factored in.
The headline poverty figures have both since fallen back from those levels – particularly pensioner poverty. In today's Britain, 2 million pensioners live below the poverty line – half the 1990 figure – while child poverty has dropped more modesty to 2.3 million.
Incomes, of course, only tell a small part of the story when it comes to Thatcher and the workforce – not to mention the shape of the economy.
Thatcher is perhaps most associated with the death of Britain's mining industry. There is no doubt that the figures show the number of miners collapsed under Thatcher and afterwards: in 1980, the UK had 230,000 coal miners. By 1990, only 57,000 remained. By 2004, the figure was below 6,000.
But what may be missed is that even more mining jobs were lost before Thatcher ever came into power. Over the course of the 1960s and 70s, more than 300,000 coal mining jobs disappeared, while around a million vanished between 1920 and 1980.
Thatcher was the coal industry's most visible foe, but not the one who lost it the most jobs. The root of residual anger at Thatcher lies, perhaps, in that Thatcher was the first post-war prime minister to cut such jobs without finding or creating replacement roles
That isn't to say that manufacturing and mining communities didn't feel devastating change – from which some have not recovered to this day. By the World Bank's measures, industry (including manufacturing) fell from contributing 40% of the UK's GDP in 1979 to just 34% in 1990 – and has since fallen more dramatically still to just under 22%.
Such trends weren't confined to the UK, however: industry in the United States fell from 33% to 27% during the Thatcher era, and to about 20% today. Even Germany went in a similar direction – though to a lesser extent – from 42% in 1979 to 28% now.
The consequences of deindustrialisation hit huge swaths of the UK, particularly Wales and northern England, hard. Unemployment soared from 5.3% in 1979 – a level high enough for the Conservatives' "Labour isn't Working" poster to go down in the annals of great election adverts – to peak at 11.9% in 1984. In 1990, the year of Thatcher's departure, it stood slightly higher than when her era began, at 6.9%.
This, though, hides the plight of millions of Britons who would never work again – those who were listed as ill, rather than unemployed.
In 1981, 772,000 people classed themselves as being out of the labour force because they were "permanently sick". A decade later, this figure had risen to 1.6 million. In numerous towns across the country, the increases were markedly higher – with those signed off sick tripling or even quadrupling in a decade. Twenty years later, in the 2011 census, the figure remained largely unchanged, despite the UK's growing population: 1.7 million people were classed as long-term sick or disabled.
The issue around the welfare bill for supporting people with disabilities, chosen as a priority by the current coalition, owes its genesis far more to Thatcher than to either John Major or New Labour.
Elsewhere in the workforce, Thatcherism did what might be expected. It was certainly bad for union membership, which fell from 13.2 million in 1979 to 9.8 million in 1990 – and has since fallen further, to less than 7.4 million.
Overall, strikes were busted too, through the use of laws that unions still condemn today: in 1979, 6m working days were lost to strikes. This peaked at a massive 29.5m in 1983, but fell to less than 2m in the year Thatcher was ousted. By 2010, whether thanks to diminished union power or improved industrial relations, fewer than 400,000 working days were lost to industrial action.
The Thatcher period was modestly good for women in the workforce, with full-time female hourly wages rising from 72% of those of men to 76% (they have continued their slow rise and are presently at 82% of men's wages).
Thatcher also leaves an unclear legacy when it comes to public spending. When she entered office, public spending made up 44.6% of GDP. After initially rising, this was sharply cut to 39.1% of GDP by the time of her departure. Since then, that trend has been more than reversed: in 2012, public spending accounted for 46.2% of GDP.
Whether you like or loathe the results, it's hard to disagree that Thatcher won her economic battles. But economic liberalism was only part of Thatcher's brand of politics. At the core of her ideology was a social conservatism, accompanied by promotion of "traditional moral values".
Care should be taken before forcing Thatcher into the mould of the US Republican party's fringes on social issues: she voted in favour of decriminalising homosexuality and abortion. However, she was no friend to the gay rights movement, complaining to the 1987 Tory conference that "children who need to be taught to respect traditional moral values are being taught that they have an inalienable right to be gay".
Such attitudes, enshrined in law through section 28, seemed to chime with the public at the time. The British Social Attitudes survey showed the proportion of the UK population who believed same-sex relations were "always wrong" was 50% in 1983, rising – fuelled perhaps by the emergence of Aids – to 58% in 1990.
But since then, the culture wars have moved in exactly the opposite direction. Today, only 20% of the British public answer the question in such a way.
Attitudes to marriage and divorce hardly stayed conservative during Thatcher's tenure, either. The number of weddings fell from 369,000 in 1979 to 331,000 in 1990, while divorces rose from 119,000 a year to 153,000 over the same time. The proportion of the public objecting to premarital sex dropped too, from 28% in 1983, to 22% in 1990, to just 12% today.
It seems that Thatcher also never really had the public believing in the ideological shifts she was making in Britain. When pollsters asked Britons in 1989 whether they would prefer a "mostly socialist" or "mainly capitalist" society, they favoured the former by a margin of 47% to 39%.
A society "which emphasises the social and collective provision of welfare" was favoured over one "where the individual is encouraged to look after himself" by a wider margin still: 54% to 40%.
Thatcher may not have changed the majority of minds during her tenure: but in the long run, the changed Britain she helped build may have continued that work. When Ipsos MORI asked that same question on welfare in 2009, the welfare option lost out narrowly to individualism, by 47% to 49% (with the margin of error, too close to call).
The evidence suggests Thatcher's children, and those who came after, have grown up more individualistic and less supportive of state institutions than their forebears. On those issues, she may well have had the last laugh.
The legacy of Thatcher's social conservatism is modest: Britain is, by and large, a nation marrying less, more accepting of homosexuality, and more accepting of people of other races (if not of immigration). Her cultural legacy is greater. In 2013, almost no one argues about what John Major did or didn't do for the country – while the mere mention of Thatcher's name can induce either exhortations of adoration or paroxysms of utter disgust.
But it's the economic changes during Thatcher's premiership, continued in large part by her successors, that have really shaped Britain ever since.
The rise of the property market and liberalisation of the financial sector shaped the economic booms of the late 1990s and most of the 2000s, and lay at the heart of the bust which followed. The unions remain weaker, and the utilities remain privatised.
Today's levels of economic inequality are roughly the same as those when Thatcher departed. The number of people classed as long-term sick, and relying consequently on the state's support, remains the same.
Whether defined against her or not, the challenges faced by the coalition government – and the circumstances that brought them to be – almost all had their roots in the government of Thatcher. And that legacy affects millions of people every day.
No comments:
Post a Comment